Stock
Quarterly summary
|
Concept |
3T’20 |
3T’19 |
% cambio |
|
Consolidated Net Sales |
476 |
554 |
-14.1% |
|
Flat Glass |
428 |
497 |
-13.9% |
|
Containers |
49 |
57 |
-13.0% |
|
Sales cost |
361 |
407 |
-11.2% |
|
Gross profit |
115 |
147 |
-21.9% |
|
Gross margin |
24.2% |
26.6% |
-2.4 pp |
|
General expenses |
76 |
95 |
-20.6% |
|
General Expenses% Sales |
15.9% |
17.2% |
-1.3 pp |
|
EBIT (1) |
39 |
52 |
-24.3% |
|
EBIT margin |
-8.3% |
9.4% |
-1.1 pp |
|
EBITDA Flow (1) |
77 |
93 |
-17.4% |
|
Flat Glass |
63 |
75 |
-16.1% |
|
Containers |
12 |
15 |
-22.3% |
|
EBITDA Flow margin |
-16.1% |
16.8% |
-0.7 pp |
|
Net profit |
14 |
40 |
-66.0% |
|
Cash Flow from operations before Capex |
83 |
72 |
-15.4% |
|
Total Debt |
746 |
714 |
-4.4% |
|
Short term |
126 |
14 |
789.3% |
|
Long term |
619 |
700 |
-11.5% |
|
Cash and cash equivalents |
262 |
125 |
109.0% |
|
Total Net Debit |
483 |
588 |
-17.8% |
*Millions of dollars
EBIT and EBITDA are presented before other expenses and income
EBIT and EBITDA are presented before other expenses and income
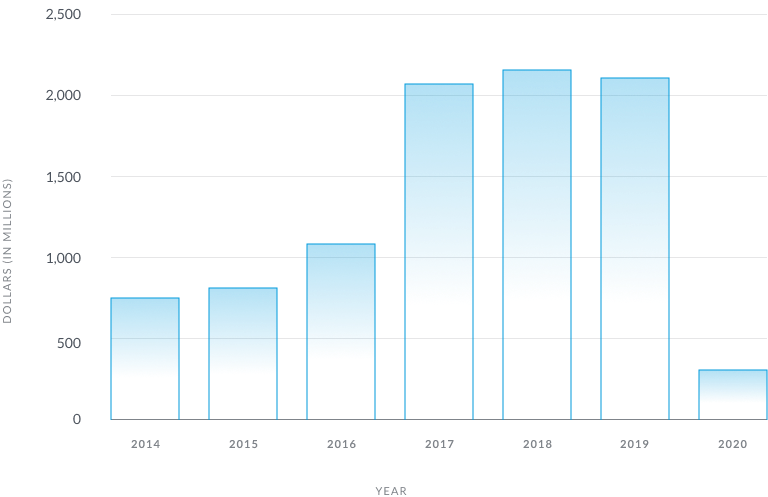
Track Vitro's financial performance.
Select the chart you are interested in.
Select the chart you are interested in.